Ask a Doubt
Get your questions answered by the expert for free
Enter text here...
Other Related Questions on mechanics

A metal strip clamped at one end vibrates with a frequency of 20 Hz and amplitude of 5 mmat the free end, where a small mass of 2 g is positioned. determine(i) The velocity of the end when passing through the zero position(ii) The acceleration at maximum displacement(iii) The maximum kinetic energy of the mass
mechanics
2 Answers Available
Last Activity: 2 Years ago

An object of mass m = 0.25 kg oscillates in a fluid at the end of a vertical spring of springconstant kH = 85 N/m, see Fig.1. The effect of the fluid resistance is governed by thedamping constant b = 0.07kg/s.(i) Find the period of the damped oscillation.(ii) By what percentage does the amplitude of the oscillation decrease in each cycle?
mechanics
1 Answer Available
Last Activity: 2 Years ago

If a=x² find the displacement at t =3sec if body velocity at t= 0 sec is 0
mechanics
1 Answer Available
Last Activity: 2 Years ago

A particle is traveling in a circle of radius R =2.5m and with an angular velocity of 10 rad/s. What is the centripetal acceleration of the particle? The particle begins to slow down with an angular acceleration of -1 rad/s2. After 5 seconds, what is the centripetal acceleration and the tangential acceleration fo the particle?
mechanics
1 Answer Available
Last Activity: 2 Years ago

If the acceleration of block A is 5 m/s^2Find the acceleration of block B
mechanics
1 Answer Available
Last Activity: 2 Years ago


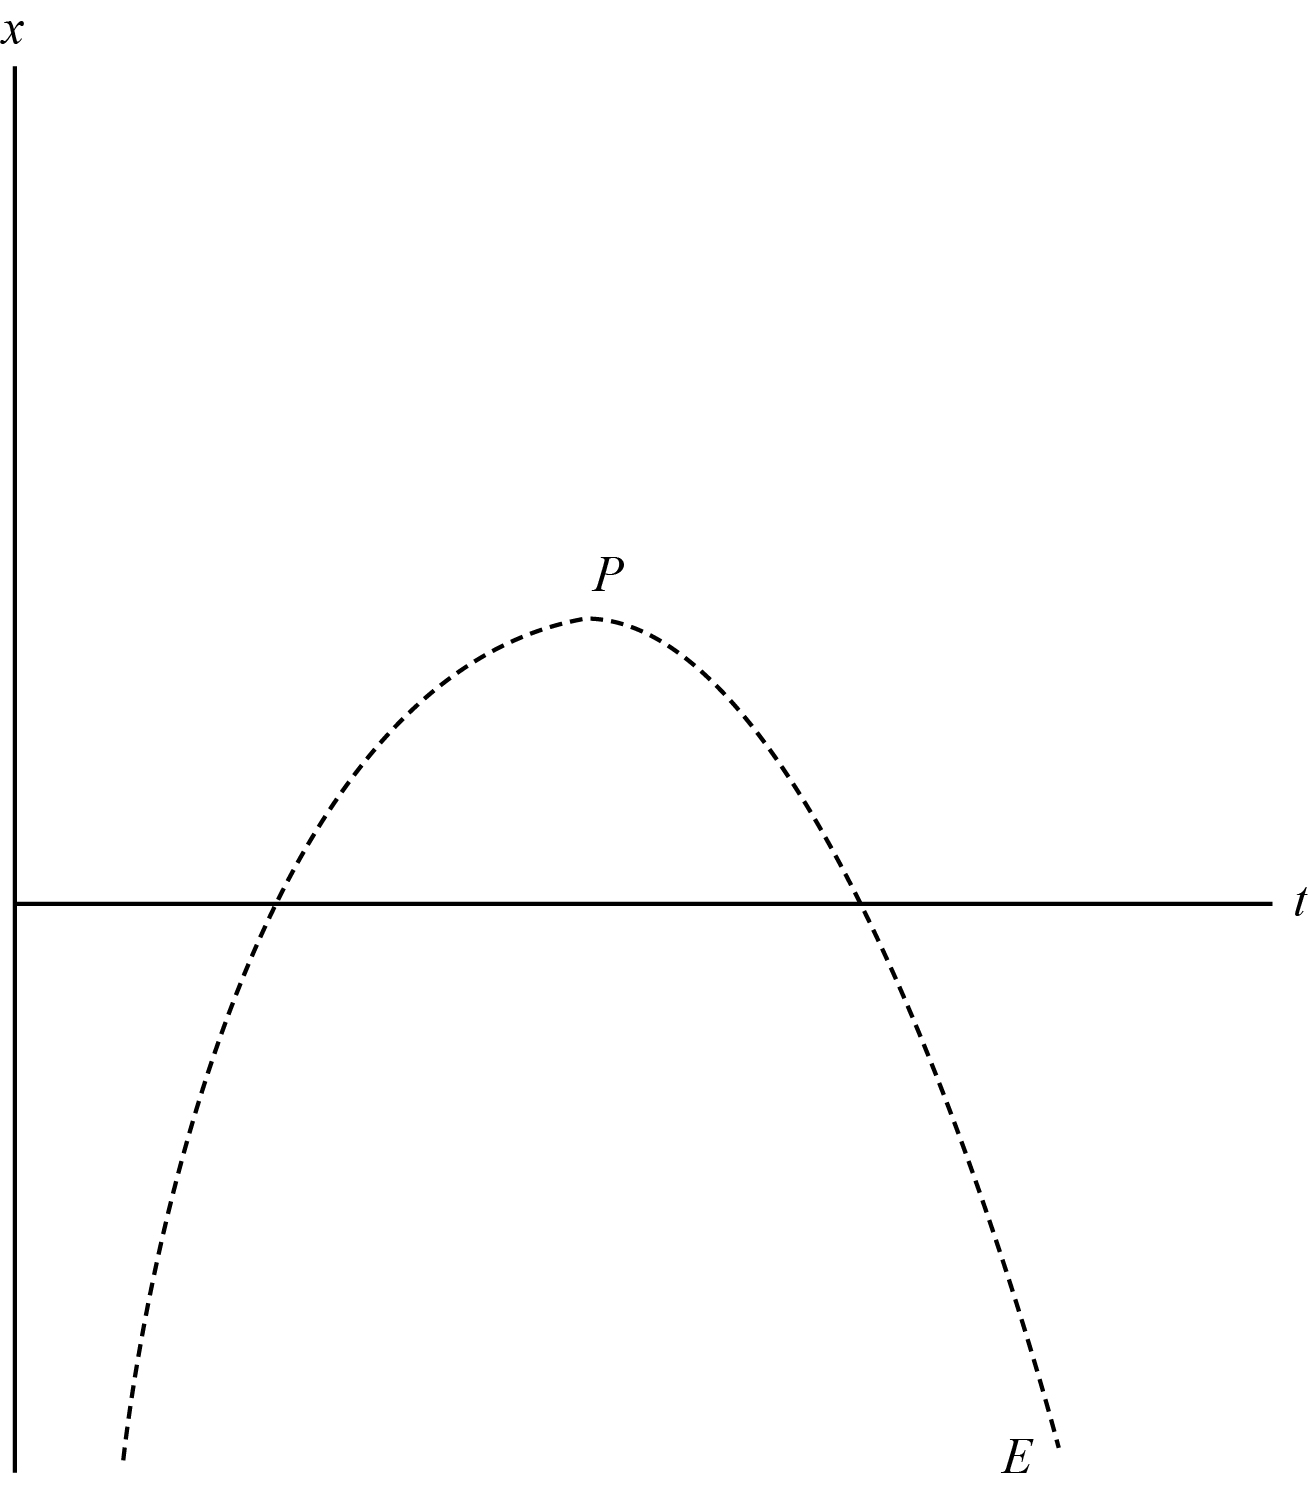
 that the position depends both on the first and second power of variable t , and therefore the graph representing the same should be a parabola.
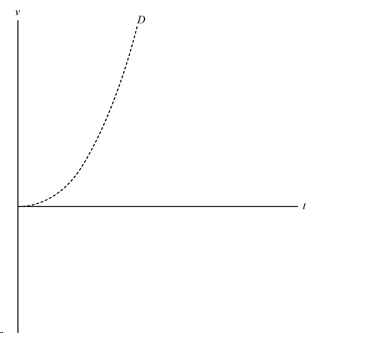
 , the magnitude of velocity increases infinitely.


