Exponential and Logarithmic Functions
Table of Content |
|
|
Exponents
Exponent is the power of a base number which shows that how many times we need to multiply a number.
As in the above figure, 8 is the base number and 3 is the exponent which tells us to multiply 8 for 3 times.
Exponential Functions
Exponential function is defined as a function
f(x) = bx
where b > 0, b is the base number and x is the exponent which can be any real number.
This shows that if b > 1, then the function increases as the value of x increases. The slope of the function also increases as the value of x increases.
Example
What is the exponential function of 2x ?
Solution: Exponential function is
f(x) = bx
Here b =2
So f(x) = 2x
| x | -3 | -2 | -1 | 0 | 1 | 2 | 3 |
| f(x) | 1/8 | 1/4 | 1/2 | 1 | 2 | 4 | 8 |
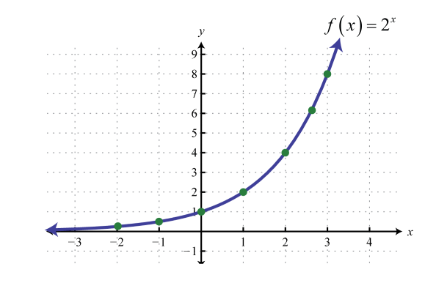
This shows that as the value of x increases, the value of function also increases.
Graph of Exponential Function
The graph of exponential function is asymptotic to the x-axis that is, it gets very close to the x-axis but never touch it. It has a constant change in the independent variable i.e. x (as in the above example it is increases with one at every step) with the same proportional change in the dependent variable that is, y or f(x) (as it has constant change of ×2).
1. if b =1
If b =1 then the function will be like
Which will be always one, even if the value of x increases, the value of the function will remain same that is, 1.
So this is called a Constant Function.
2. if b > 1
As in the above example b = 2 that is, greater than 1.
-
This shows that as the value of x increases the slope of the function also increases.
-
The curve passes through the point (0, 1).
-
The curve gets closer to the x-axis but does not touch or crosses it.
3. if 0 < c < 1
Let’s see the graph of function
y = f(x) = cx,when 0 < c < 1
Graph of g(x) = (1/2)x
f(x) = (2/3)x
h(x) = (1/3)x
4. if b= e
This is the case of special exponential function, so it is called ‘the’ Exponential Function. As it arises naturally sometimes so it is also called Natural Exponential Function.
The exponential function in this case is like
f(x) = ex
where, e= 2.718(approximately)
The graph of the functions f(x) = ex
Properties of Exponential Function
-
Domain of the exponential function is R, the set of all real numbers that is, ( -∞, ∞).
-
Range of the exponential function is the set of all positive real numbers that is, (0, ∞).
-
The point (0, 1) is always on the graph of the exponential function as b0 = 1 for any real number b > 1 that is, b ≠ 0.
-
Exponential function is ever increasing which means as we go from left to right the graph of function goes up.
-
For the negative values of x, the exponential function is very close to 0 that is, the graph we go closer to x axis but will never meet it.
-
For every possible b, where bx > 0 this implies that bx ≠ 0.
-
If 0 < b < 1, then the graph of the function bx will decrease as we go from left to right. As given in the graph above.
-
If bx = by then x = y.
What is the definition of Logarithm Function?
The logarithm function is defined as:
f(x) = logbx
where b > 0 and b ≠ 1 and also x >0, reads as “ log base b of x”.
The base of the logarithm is b.
Generally we use the base 10(Common Logarithm) and base e (Natural Logarithm).
Example
 Write in logarithm form 8 = 23.
Solution: Here which is given is the exponential form and we need to convert it in the logarithm form.
Base is 2 and exponent is 3.
Graph of Logarithm Function
1. if b > 1
Let b = 2
f(x) = log2x that is, 2f(x) = x
| x | 1/4 | 1/2 | 1 | 2 | 4 |
| f(x) | -2 | -1 | 0 | 1 | 2 |
For logarithm function f (1) = 0 for all the values of b, so (1, 0) will always a point for any value of b.
2. if 0 < b < 1
Let b = ½ then f(x) = log1/2 x
This shows that if 0 < b < 1 then the curve goes downwards.
As the value of y decreases the graph gets closer to y-axis but never touches it.
Here in the above figure it shows that the graph of f(x) = log2x is the reflection of the graph of f(x) = log1/2 x.
Hence,
f(x) =log2x is the reflection of the graph of f(x) = log1/2 x on the x-axis.
3. if b = e
When b = e then it is called Natural Logarithm.
f(x) = logex
It is generally written as In(x)
This passes through (1, 0) and (e, 1)
where e = 2.718(Euler number)
Features of Logarithm Functions
-
Domain of logarithm function is the set of all positive real numbers that is, (0, ∞).
-
Range of logarithm function is the set of all real numbers that is, (-∞, ∞).
-
The point (1, 0) is always there on the graph for any value of b.
-
If b >1, the logarithm function is ever increasing that is, as we move from left to right the graph also moves above.
-
The graph goes near to the y-axis but never touches it.
Properties of Logarithm Function
1. log of multiplication is the sum of logs
loga(m × n) = logam + logan
If m = n, then
logb n2 = logb n + logb n = 2 log n
2. the log of a division is the difference of the logs
loga(m/n) = logam - logan
3. the log of m with an exponent r is r times the log of m
loga(mr) = r ( logam )
4. changing the base
Here we see that to change the base we will use the property “ x goes up and a goes down”.it is the conversion factor by which we can change the base to any other base.
5. if logba = c then a = bc
6. log b1 = 0
7. logbb = 1
8. logb a = 1/loga b
a = bc and b = ad
a = bc and a = b(1/d)
c = 1/d
9. logbxy = y log bx
What is the inverse of the log?
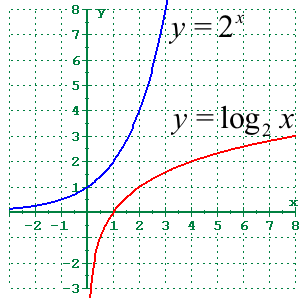
The exponential function is the inverse of the logarithm function.so they are called the Inverse Function. Both the functions work together.
ax = y is the inverse of logay = x.
Here the base should be same as ‘a’ is the base here. Like wise the graph of the exponential function is also the inverse of the graph of the logarithm function.
Both the graphs are the reflection of each other along the line y = x.
The domain of the logarithm function is the range of the exponential function and the range of the logarithm function is the domain of the exponential function.
What is Exponential and Logarithm Functions?
Exponential and Logarithm Functions go all together.
| Exponential | Logarithm | |
| x | f(x) = bx | f(x) = logbX |
| If b = 1 | f(x) = 1x, Constant function | Not considered as it does not give a valid function. |
| If b >1 | As the value of x increases the slope of the function also increases. | As we move from left to right the graph alos moves above. |
| If 0 < 0 < 1 | The function will decrease as we go from left to right. | As we move from left to right the graph alos moves down. |
| Common function | f(x) = 10x | f(x) = log10X |
| Natural function | f(x) = ex | f(x) = logeX |
| Undo each other | logα(αx) = x | αlogα(x)=x |
Example
Calculate y in y=log5(1/5)
Solution:
5y = 5log5(1/5 ) (Use the Exponential Function on both sides)
5y = 1/5 (after simplifying)
Now we know that 1/5 = 5-1
So 5y = 5-1
Hence y = -1
What are the uses of logarithms in the real world?
1. The magnitude of an earthquake is a Logarithmic scale. The famous "Richter Scale" uses this formula:
M = log10 A + B
Where A is the amplitude (in mm) measured by the Seismograph and B is a distance correction factor.
2. Loudness is measured in Decibels (dB for short):
Loudness in dB = 10 log10 (p × 1012)
where p is the sound pressure.
3. Acidity (or Alkalinity) is measured in pH:
pH = −log10 [H+]
where H+ is the molar concentration of dissolved hydrogen ions.
More Readings


