Graphical Solution of Linear Inequalities in Two Variables
Table of Content |
Linear Inequality in two variables
If there are two variables in a linear function then it is linear inequality in two variables.
Example
2x + 3y > 50
There are two variables x and y in this linear inequality.
Solution of Linear Inequality in two variables
The solution of a linear inequality in two variables like ax + by > c is an ordered pair (x, y) that gives a true statement when we put the values of x and y into the inequality. We will solve the linear inequality, with the same method of solving linear equations.
We have to find the solution by assuming first x=0 then y=0. So that we can find the solution for the given problem.
Example
Solve x + 9y < 27.
Solution:
We will find the pair of values of x and y for the solution set.
Let x = 0
0 + 9y < 27
9y < 27
y < 3
Let y = 0
x + 9(0) < 27
x < 27
So the solution of the given inequality are (0, 3) and (27, 0).
This shows that if x = 0 then y could be less than 3 that is, 0, 1, 2. We will not include 3 here as it is less than three only not less than or equal to three. The solution set for this are:
(0, 0), (0, 1), (0, 2).
All the coordinates of these ordered pairs will come in the solution part.
Similarly we can find the solution set by assuming the value of x as 1, 2, 3 and so on.
Graphical Solution of Linear Inequalities in Two Variables
The graph of an inequality is the visual representation of the solution of the inequality.
The solution of the linear inequality with two variables is represented by the half plane on the Cartesian or coordinate plane.
What is a coordinate plane?
A Cartesian plane is made up of two perpendicular number lines, that is, x-axis (horizontal) and y-axis (vertical) to represent the two variables.
- Any point on the plane is denoted by the ordered pair of numbers.
- The point where these two lines intersect each other is the center or origin of the coordinate plane. Its coordinates are (0, 0).
- The Cartesian plane is divided into four quadrants I, II, III and IV.
What is an ordered pair?
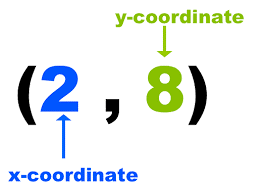
Ordered Pair is a pair of numbers in a special order. We have to separate the numbers with the comma and enclosed in a parentheses.
 We always have to write the number in a certain order, that is,
-
x-coordinate first ( which represents the horizontal distance)
-
y-coordinate second (which represents the vertical distance)
What is a half-plane?
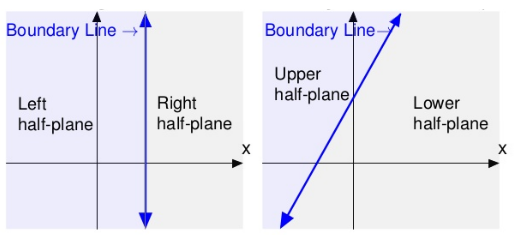
When we graph a linear equation in a coordinate plane then that line of equation divides the plane in two parts. Each part is called Half Plane.
-
A vertical line divides the plane in left-half plane and right-half plane.
-
A non-vertical line divides the plane in upper-half plane and lower-half plane.
-
The line of equation which divides the plane is called Boundary Line.
Solution region
When we solve a linear inequality and draw a graph for it, then we have to shade the region or half plane which contains the solution of the inequality. That half plane is called the solution region.
So the half plane which contains all the solutions of an inequality is called the Solution Region.
-
we will shade the lower region that is, below the line for < or ≤ sign, or
-
The upper region that is, above the line for > or ≥ sign.
Boundary line
The line of equation is the boundary line. In case of inequality,
- Solid line for “≥” (greater than or equal to) or “≤” ( less than equal to ) which shows that the line is included in the solution
- Dashed line for “<” (less than) or “>” (greater than) sign which shows that the line is not included in the solution.
What is slope-intercept form?
For the graphical representation of the inequality, first we need to convert the equation in the slope intercept form.
y = mx + b
In this form we have the convert the equation in such a way that
- y should be alone on the left hand side.
- m is the slope of the line.
- b is the y intercept (0,b) i.e. the coordinates where the line intersects the y axis
Example
Convert the inequality in the slope-intercept form.
y – 1< – 3(x + 2)
Solution:
For the slope-intercept form we have to isolate the variable y on the left side.
y-1<-3x-6
y<-3x-6+1
y<-3x-6
Hence, slope is -3 and y-intercept is -6 for this inequality.
What is the possibility of a point to be in the Cartesian plane?
The point will be either on the boundary line or in the upper half plane or in the lower half plane.
1. y = mx +1
2. y < mx +1
3. y > mx +1
Let’s understand it with an example.
We have equation y = x + 3
1. Now we will assume x =0
y = 0 + 3
y = 3
(0, 3) is the coordinate which satisfies the equation so it will be on the boundary line. And any other point which satisfies the condition (x, y) will be on the boundary line.
2. Now we will take a point (0,0)
This is a true statement, and as the origin is below the boundary line so this point is in the lower half-plane.
y < x + 3
0 < 0 + 3
0 < 3
This is a true statement, and as the origin is below the boundary line so this point is in the lower half-plane.
3. Now we will take a point (0,4)
y > x + 3
4 > 0 + 3
4 > 3
This is a true statement so this point is above the boundary line.
How to test which is the solution set of the inequality?
For any inequality, first we will make the boundary line either dashed or solid according to the sign of inequality.
Then we will choose one point to check whether it satisfies the inequality or not. Generally, we choose (0, 0) as it is the easiest point to solve
Let’s take one example to understand it.
Check which half-plane is the solution set of the inequality y ≥ 2x – 1.
First we will make the boundary line of the equation y ≥ 2x – 1.
It will be a solid line as it is non-strict inequality.
Then let x = 0 and y = 0
y ≥ 2x – 1
0 ≥ 2 (0) -1
0 ≥ - 1
This is a true statement, so we will shade the half-plane which contains (0, 0) coordinates that is, the upper half plane in this example.
As the upper half-plane is the solution region, so all the points in this region will be the part of the solution set of this inequality.
How to check the ordered pair is in the solution set of the inequality or not?
We can check it by substituting the ordered pair in the equation.
Example
Check for the points (1, 3) and (3,-2) if these ordered pairs are in the solution set of the inequality y ≥ 2x -1 or not.
Solution:
y ≥ 2x-1
1. Let check for (1, 3) first.
Substitute x = 1 and y = 3
3 ≥ 2(1) – 1
3 ≥ 1
This is a true statement, so this ordered pair comes in the solution region.
2. Let check for (3,-2) now
-2 ≥ 2(3) -1
-2 ≥ 5
This is a false statement, so this ordered pair is not comes in the solution region.
If you know the solution region then you can check it by plotting the point on the graph.
Steps for the Graphical Solution of Linear Inequalities in Two Variables
1. First of all convert the equation in the slope-intercept form as it is the straight forward form to make a graph of line.
2. Then solve the equation as the linear equation with equality sign to find the solution.
If x = 0 then y = a
y = 0 then x = b
3. Then we will draw a line on the graph using the solution set that is, (0, a) and (b, 0). Joining these two points we will get the line of our equation.
4. Now substitute the given equation with (0, 0). If it satisfies the inequality then shade the region which contains (0, 0) and if it does not satisfies then shade the region which does not contain (0, 0) point.
5. if there is ≥ and ≤ sign then we will make a solid line which shows that the line is included in the solution or a dashed line for < and > sign which shows that the line is not included in the solution.
6. That shaded part is the solution of the given linear inequality.
Example
Solve graphically y < 2x + 1
Solution:
1. First we will find the solution of the equation by assuming x = 0 first and then x = 1.
y = 2x +1
Let x = 0
y = 2(0) +1
y = 1
Let x = 1
y = 2(1) +1
y = 3
So the coordinates of the line are (0, 1) and (1, 3)
2. Joining these two points we will get the line of equation y = 2x + 1.
3. As the sign of inequality is < that is, the strict inequality so the boundary line will be a dashed line.
4. Now we will check for the solution region by substituting x = 0 and y = 0.
y < 2x +1
0 < 2(0) +1
This is a true statement so the solution region will be on the half-plane which contains (0, 0) coordinates.
5. So we will shade the lower half plane that is, below the boundary line.
More Readings
View courses by askIITians


Design classes One-on-One in your own way with Top IITians/Medical Professionals
Click Here Know More

Complete Self Study Package designed by Industry Leading Experts
Click Here Know More

Live 1-1 coding classes to unleash the Creator in your Child
Click Here Know More

a Complete All-in-One Study package Fully Loaded inside a Tablet!
Click Here Know MoreAsk a Doubt
Get your questions answered by the expert for free


