Chapter 22 Data Handling II (Pictographs) Exercise 22.2
Question: 1
The following are the details or the number of students in a class of 30 students presents a week.
| Day | Number of students present |
| Monday | 24 |
| Tuesday | 20 |
| Wednesday | 28 |
| Thursday | 30 |
| Friday | 26 |
| Saturday | 22 |
Represent the above data by a pictograph.
Solution:
Let an icon of a student represent 4 students. Then, the number of icons for each day is as follows:
| Day | Number of students present |
| Monday | 24 / 4 = 6 |
| Tuesday | 20 / 4 = 5 |
| Wednesday | 28 / 4 = 7 |
| Thursday | 30 / 4 = 7.5 |
| Friday | 26 / 4 = 6.5 |
| Saturday | 22 / 4 = 5.5 |
The pictograph representing the above data is as follows:

Question: 2
Total number of students of a school in different years is shown in the following table:
| Year | Number of students |
| 1996 | 400 |
| 1998 | 550 |
| 2000 | 450 |
| 2002 | 600 |
| 2006 | 650 |
Represent the above data by a pictograph.
(a) Prepare a pictograph of students using one symbol an icon of a student to represent students and answer the following questions:
(i) How many symbols represent total number of students in the year 2002?
(ii) How many symbols represent total number of students for the year 1998?
(b) Prepare another pictograph of students using any other symbol each represents students. Which pictograph do you find more informative?
Solution:
(a) Let one icon represent 100 students.
Then, the numbers of icons for different years are as follows:
| Year | Number of students |
| 1996 | 400 / 100 = 4 |
| 1998 | 550 / 100 = 5.5 |
| 2000 | 450 / 100 = 4.5 |
| 2002 | 600 / 100 = 6 |
| 2006 | 650 / 100 = 6.5 |
The pictograph representing the above data is as follows:

(i) 6 icons represent the total number of students in the year 2002.
(ii) 5 and half icons represent the total number of students in the year 1998.
(b) Let one icon represent 50 students.
Then, the numbers of icons for different years are as follows:
| Year | Number of students |
| 1996 | 400 / 50 = 8 |
| 1998 | 550 / 50 = 11 |
| 2000 | 450 / 50 = 9 |
| 2002 | 600 / 50 = 12 |
| 2006 | 650 / 50 = 13 |
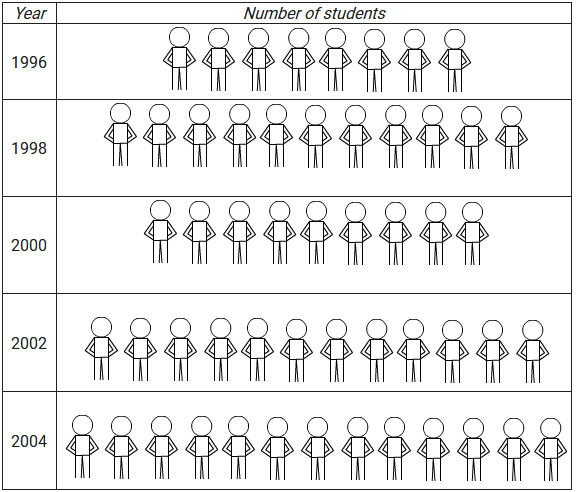
The second pictograph is more informative.
Explanation: in the second pictograph, every icon is complete, therefore more convenient to understand.
View courses by askIITians


Design classes One-on-One in your own way with Top IITians/Medical Professionals
Click Here Know More

Complete Self Study Package designed by Industry Leading Experts
Click Here Know More

Live 1-1 coding classes to unleash the Creator in your Child
Click Here Know More